One of GA4’s biggest limitations is its ability to report on data for the current day. The data available on the real-time screen is severely limited, and with all the other reports there is no guarantee of how fresh the data is. In this tutorial, I’ll show you how to use the exported data in BigQuery to build a real-time report that can include any metric you want and can be refreshed as often as you need.
Introduction
There are many reasons why you might want to report on the data from your website or app in real time. From monitoring errors to tracking the performance of a new marketing campaign, it’s an essential feature for many businesses.
Whilst GA4 does have a real-time report, it is rather basic and doesn’t provide much detail. Fortunately, however, you can build your own real-time reporting using the data in BigQuery. All you need to do is enable the Streaming export, and all the data for the current day will be available within a few minutes via the GA4 BigQuery export.
An overview of the streaming export
When you link your GA4 property to BigQuery, you have two options for the events export: daily and streaming. With the streaming export, data is exported continuously throughout the day to a separate table named events_intraday_YYYYMMDD.
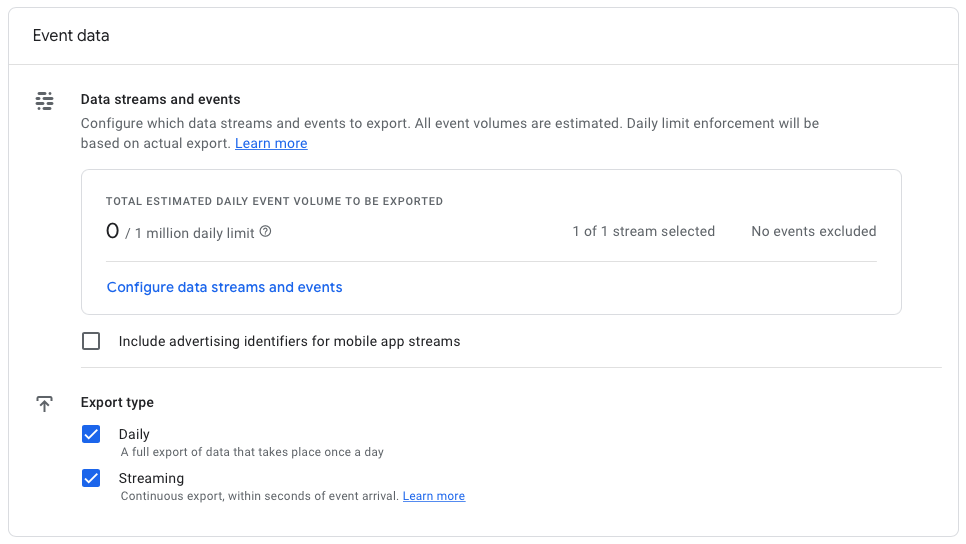
Unlike the regular daily export, the streaming export will incur additional costs for ingestion. However, current pricing is only about $0.05 per GB exported, so it will still be very cost-effective for most people.
The process we’ll be following
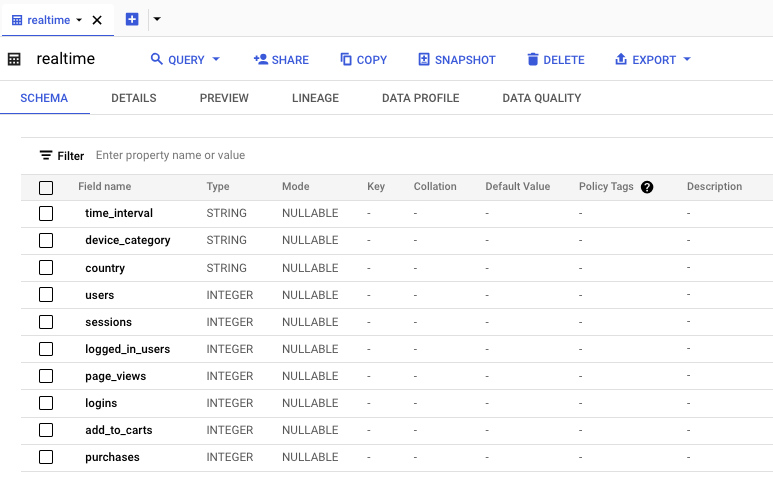
To create the real-time report, we will write a query that extracts key metrics from the events_intraday table, such as users, sessions, and purchases, in 5-minute intervals.
We’ll then set up a scheduled query that saves the data to a table and schedule it to run every 15 minutes. Lastly, we will connect Looker Studio to that table and build a dashboard using the data.
Controlling query costs with scheduled queries
We could connect Looker Studio directly to the events_intraday table, extracting the latest data each time the user refreshes the dashboard. However, doing so would mean we have no control over our compute costs (the costs incurred each time a query runs in BigQuery).
Every dashboard refresh would consume compute resources, and if you collect a lot of data each day and have a lot of users accessing the dashboard, then the costs could mount up quickly.
By using a scheduled query to aggregate the data into a smaller reporting table, we will have much greater control over the amount of data processed.
Even so, you still need to be mindful of the potential costs that could be incurred from scheduling the query. A 15-minute refresh means you’ll be running 96 queries per day, whilst a 5-minute refresh would be 288. If your property is only collecting a small number of events then this might not be a problem, but as the volume of events increases, so too will the costs of querying that data.
At the end of the day it’ll be up to you to decide if makes more sense to connect Looker Studio directly to the intraday table and refresh only when required, or schedule a query to automatically refresh (and how often that should be).
Building a real-time report in BigQuery
As mentioned above, we’ll be following the below steps to create our GA4 real-time report using the data exported to BigQuery:
- Extract the required fields from the events_intraday table.
- Calculate key metrics for each 5-minute interval.
- Create a scheduled query to update the data every 15 minutes.
- Connect Looker Studio to the new table and build dashboard
Step 1 – extract key fields and parameters
The first step in our query is a CTE that extracts the columns and event parameters we’ll be using later on. As explained in the easy way to calculate GA4 metrics, this is just to reduce complexity and make the query easier to read and maintain.
In this step we are also creating a new field called time_interval, which rounds the event_timestamp down to the nearest 5-minute interval.
I’ve included a WHERE clause to ensure we are only querying against the intraday table for the current day. I’ve added this because sometimes there may be 2 intraday tables in your dataset, one for the current day and one for the previous day. The previous day’s table will be deleted at some point during the day, but there is no guarantee at what point this will happen.
WITH dataset AS (
  SELECT
    event_name,
    TIMESTAMP_MICROS(event_timestamp) as event_time,
    TIMESTAMP_SUB(TIMESTAMP_SECONDS(5 * 60 * DIV(UNIX_SECONDS(TIMESTAMP_MICROS(event_timestamp)), 5 * 60)), INTERVAL 0 SECOND) as time_interval,
    user_id,
    user_pseudo_id,
    CONCAT(user_pseudo_id, (SELECT value.int_value FROM UNNEST(event_params) WHERE key = 'ga_session_id')) AS session_id,
    device.category as device_category,
    geo.country
  FROM `<project>.<dataset>.events_intraday_*`
  WHERE _TABLE_SUFFIX = FORMAT_DATE('%Y%m%d', CURRENT_DATE())
)
Note: you can easily round down to a different interval if you want, just replace the 5’s with the relevant interval you need.
E.g. for a 15-minute interval you’d set it to 15:
TIMESTAMP_SUB(TIMESTAMP_SECONDS(15 * 60 * DIV(UNIX_SECONDS(TIMESTAMP_MICROS(event_timestamp)), 15 * 60)), INTERVAL 0 SECOND) as time_intervalOr for a 30-minute interval it would be 30:
TIMESTAMP_SUB(TIMESTAMP_SECONDS(30 * 60 * DIV(UNIX_SECONDS(TIMESTAMP_MICROS(event_timestamp)), 30 * 60)), INTERVAL 0 SECOND) as time_intervalStep 2 – calculate key metrics
Next, we use the data extracted in step 1 to calculate the metrics we want to track. What you include here is up to you, I’ve just included some basic metrics as an example.
In addition to the time_interval, I’ve included device_category and country as dimensions to provide a further level of detail.
Finally, since the event_timestamp field is stored in UTC time, that means our new time_interval value is also in UTC time. So we are using the TIME function to convert this into London time, and then extracting just the hour and minute values from the timestamp to improve readability on our report.
SELECT
  CONCAT(FORMAT("%02d",EXTRACT(hour FROM TIME(time_interval, 'Europe/London'))), ":", FORMAT("%02d",EXTRACT(minute FROM TIME(time_interval, 'Europe/London')))) as time_interval,
  device_category,
  country,
  COUNT(DISTINCT user_pseudo_id) AS users,
  COUNT(DISTINCT session_id) AS sessions,
  COUNT(DISTINCT user_id) AS logged_in_users,
  COUNTIF(event_name = 'page_view') AS page_views,
  COUNTIF(event_name = 'login') AS logins,
  COUNTIF(event_name = 'add_to_cart') AS add_to_carts,
  COUNTIF(event_name = 'purchase') AS purchases
FROM dataset
GROUP BY ALL
ORDER BY 1, 2, 3
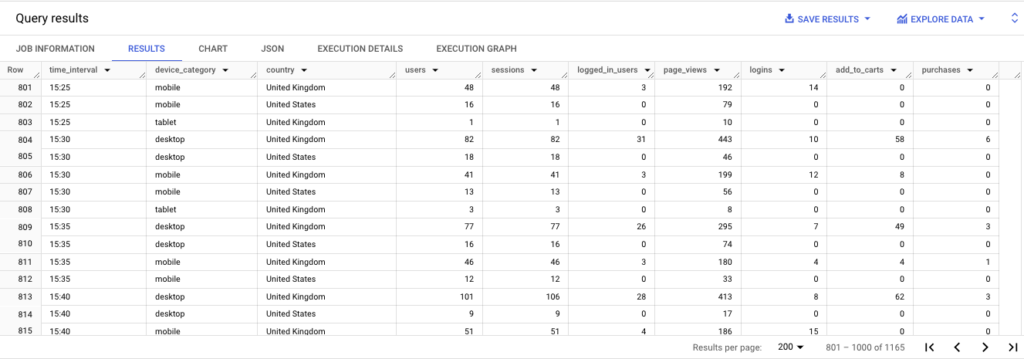
Now if we put these 2 steps together and run the query we’ll get a result that looks something like below:
Step 3 – setup scheduled query
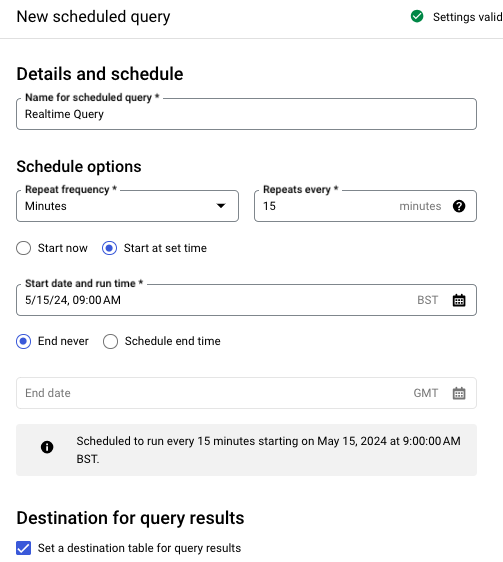
Next we need to setup a scheduled query to automatically update the data. To do so, click on SCHEDULE in the top bar.

In the window that appears, enter a name for the scheduled query and then set the frequency based on how often you want to refresh the data. I’ve gone for 15 minutes, but it’s up to you whether you need it more or less frequent. Just remember, the higher the frequency, the higher the potential costs! (note: 5 minutes is currently the lowest you can go)
You should also specify a specific time when you want the job to start, so you can then ensure the queries run at specific times (e.g. on the hour, on the half hour, etc.).
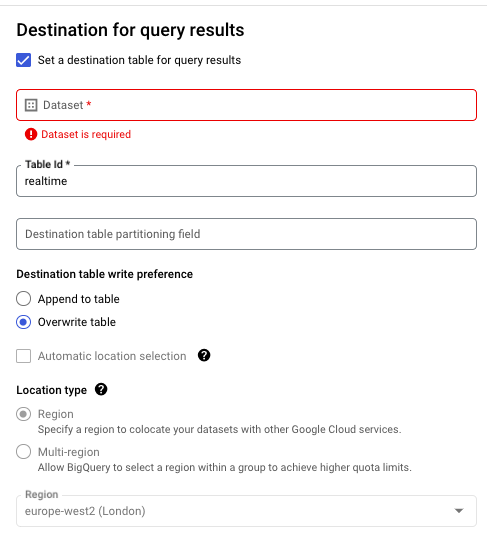
Next click Set a destination table for query results and then select the dataset where you want to write the data to (I use a separate dataset from the one into which the GA4 data is exported), and enter a name for the table you want to create.
Also ensure you select Overwrite table so that the data will be refreshed rather than appended to.
The region you select will be dependant on where your data is stored, so make sure you chose the option relevant to your project.
Finally, you might want to select Send email notifications so that you are notified of any errors with the processing of the job.
Once you are happy with the setup, click Save to create the scheduled job.
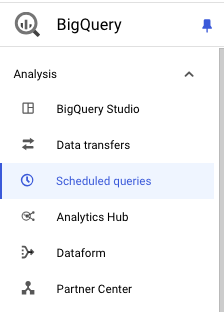
To view your scheduled queries, click on Scheduled queries in the menu on the left hand side.
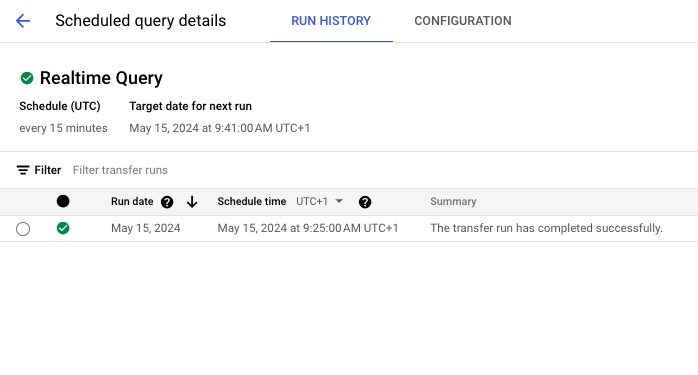
From the Scheduled queries screen you can click through into the job you just created and view details on the configuration and execution history.
If you wait for the query to process and then go back to BigQuery Studio, you should find that your new table has now been created.
Step 4 – connect to Looker Studio
You can now head over to Looker Studio and create a new report. You will first be asked to connect to a data source – click on BigQuery and then on the next screen, select the table you just created and click Add.
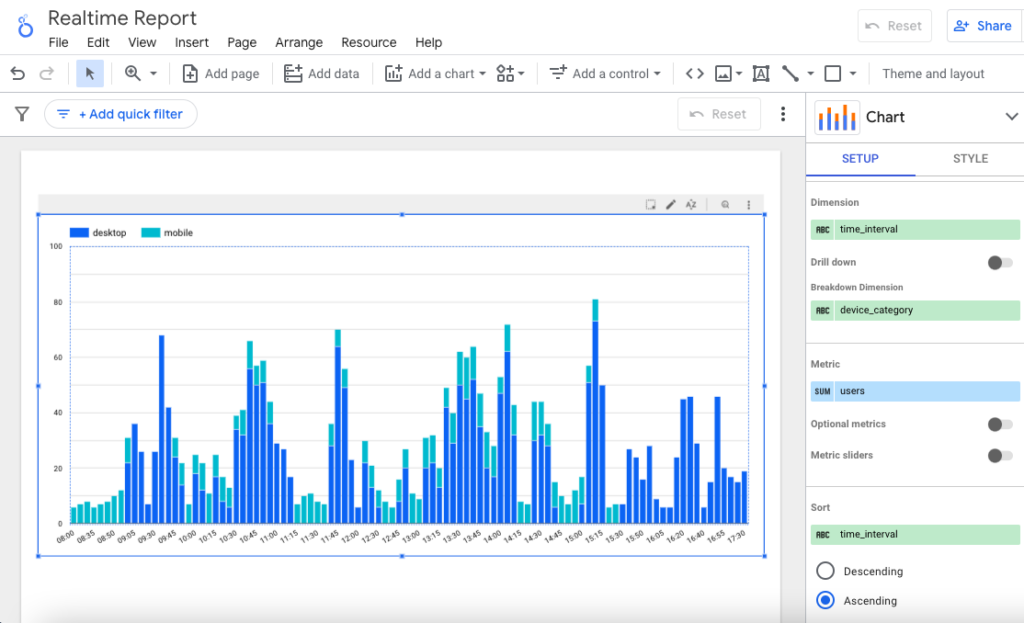
We’re now going to create a Stacked column chart with the following options:
- Dimension: time_interval
- Breakdown Dimension: device_category
- Metric: users
- Sort: time_interval (Ascending)
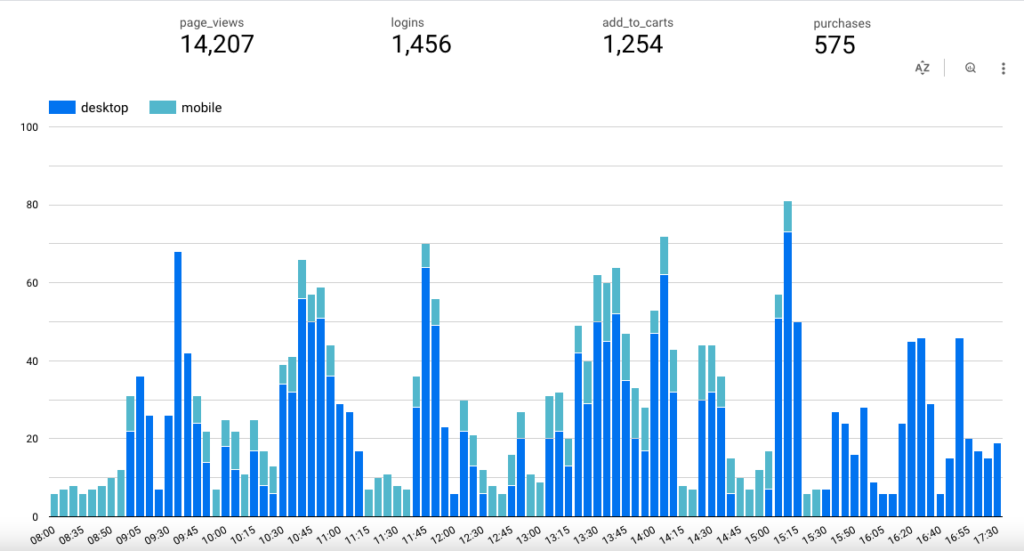
You should then end up with a chart that looks something like below, showing the number of users for each 5-minute interval, broken down between desktop and mobile devices.
Let’s also add some scorecards at the top to show the daily total for each of the events we included. I’ve not included sessions or users though since they would be duplicated across the 5-minute intervals, thus inflating the counts.
The final report should look similar to the below image.
Refreshing the report
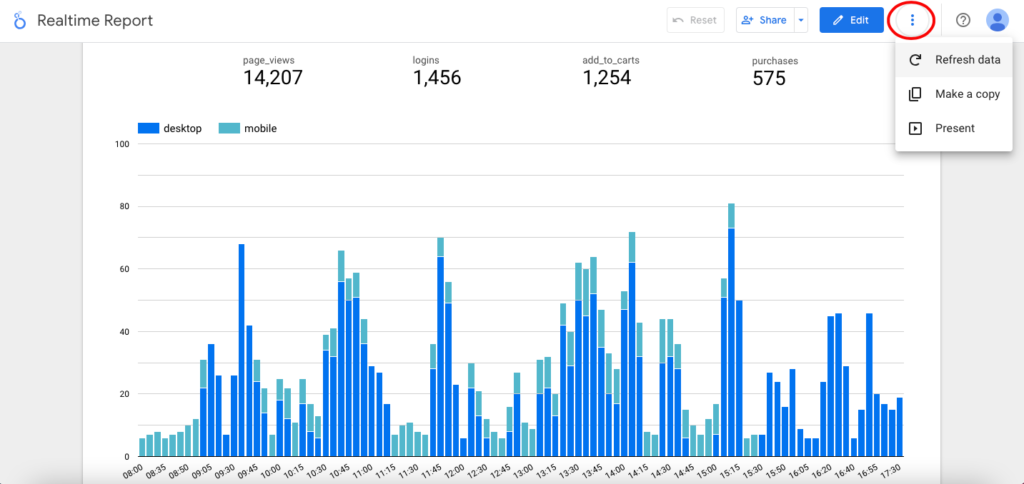
Although the underlying BigQuery table will be updated automatically by the scheduled query, the Looker Studio report won’t automatically refresh to show the latest data.
To refresh the report, just click on the 3 dots in the top right hand corner and then select Refresh data. Doing so should pull through the latest data from the BigQuery table.
Wrapping-up
You’ve now created your own real-time report that’s updated as often as you need and can include all the metrics important to your business.
Being able to visually see the trend throughout the day will enable you to monitor errors on your site or the performance of your campaigns, allowing you to react much quicker than if you were relying on the data in GA4 alone.
I hope you’ve found this tutorial useful. If so, check out some more advanced GA4 BigQuery tutorials or our free beginners course if you are just getting started.


